Performance improvement after code refactoring
I took over an existing project recently. Unfortunately, the code is difficult to understand and maintain: the code was written in procedural with many duplicated codes. It’s really painful to add new features, even modify a simple testing condition, I have to scroll up and down in a single code file with more than thousands of lines. So the primary objctive of refactoring is to improve the code design, in order to make it more easier to understand and maintain. I spent a few days to analyze the existing code, and rewritten the code in object-oriented paradigm.
After refactoring, I tested and compared the performance of both codes. The result is encouraging, the new code is running more stable and has a overall improvement in executing time. For this project is not providing simple web page services, the executing time highly depends on the specific user request context, so it’s difficult to write testing cases for benchmark. For this reason, I extracted the statistical executing time from real running environment for both version of code.
I will call the old version code and the new version code as V1 and V2 respectively. Following data and plots show the response times for server running at relatively low and high load. Every set of data was generated in one hour.
Low load situation
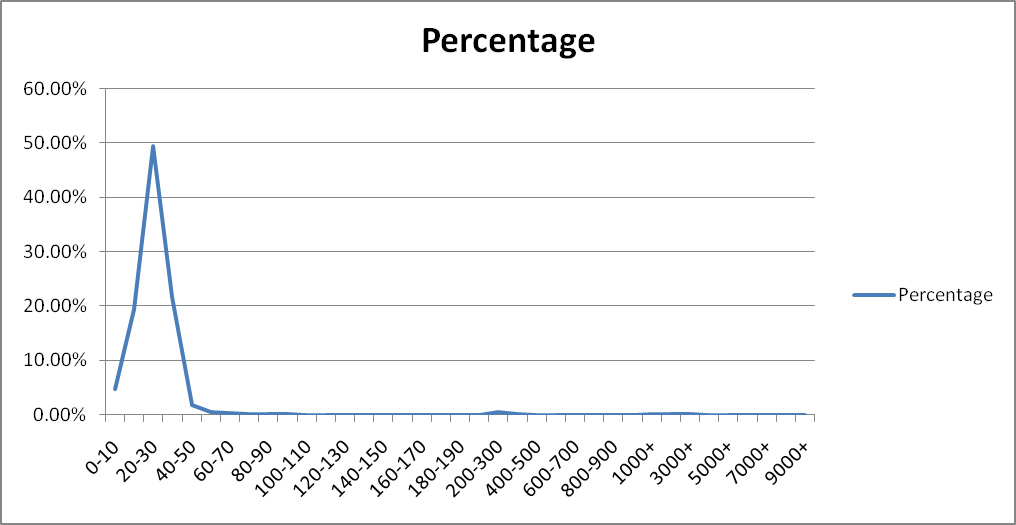
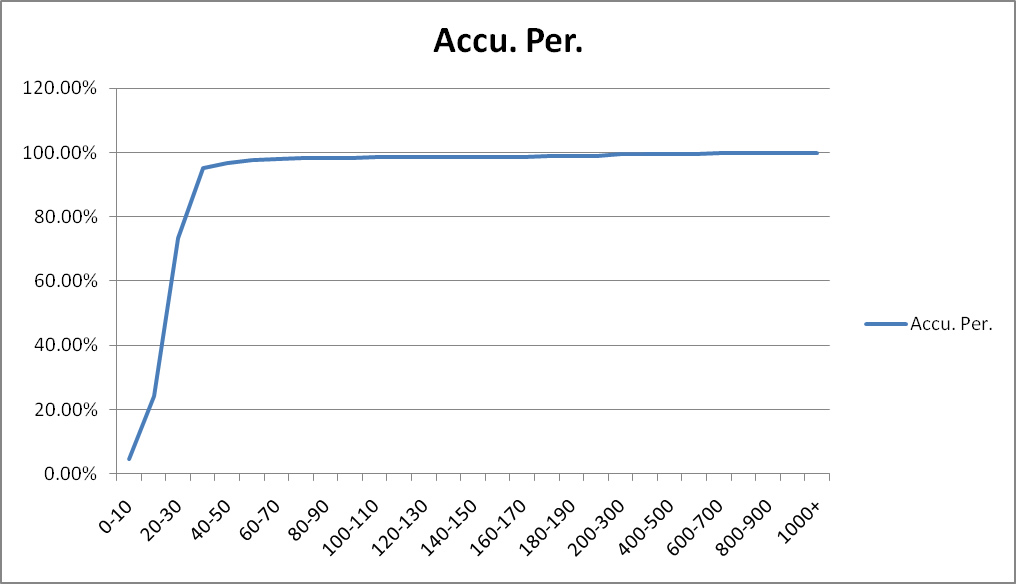
V1 response time
| Resp. Time Range(ms) | Resp Count | Percentage | Accu. Per. |
| 0-10 | 334,970 | 4.72% | 4.72% |
| 10-20 | 1,383,553 | 19.48% | 24.19% |
| 20-30 | 3,511,391 | 49.43% | 73.62% |
| 30-40 | 1,534,209 | 21.60% | 95.22% |
| 40-50 | 129,206 | 1.82% | 97.04% |
| 50-60 | 45,071 | 0.63% | 97.67% |
| 60-70 | 30,191 | 0.42% | 98.10% |
| 70-80 | 15,793 | 0.22% | 98.32% |
| 80-90 | 8,785 | 0.12% | 98.44% |
| 90-100 | 6,728 | 0.09% | 98.54% |
| 100-110 | 5,266 | 0.07% | 98.61% |
| 110-120 | 4,149 | 0.06% | 98.67% |
| 120-130 | 3,402 | 0.05% | 98.72% |
| 130-140 | 3,135 | 0.04% | 98.76% |
| 140-150 | 3,155 | 0.04% | 98.81% |
| 150-160 | 3,116 | 0.04% | 98.85% |
| 160-170 | 2,908 | 0.04% | 98.89% |
| 170-180 | 3,280 | 0.05% | 98.94% |
| 180-190 | 3,961 | 0.06% | 98.99% |
| 190-200 | 4,786 | 0.07% | 99.06% |
| 200-300 | 35,690 | 0.50% | 99.56% |
| 300-400 | 17,350 | 0.24% | 99.81% |
| 400-500 | 1,630 | 0.02% | 99.83% |
| 500-600 | 1,028 | 0.01% | 99.84% |
| 600-700 | 1,187 | 0.02% | 99.86% |
| 700-800 | 623 | 0.01% | 99.87% |
| 800-900 | 150 | 0.00% | 99.87% |
| 900-1000 | 46 | 0.00% | 99.87% |
| 1000+ | 9,080 | 0.13% | 100.00% |
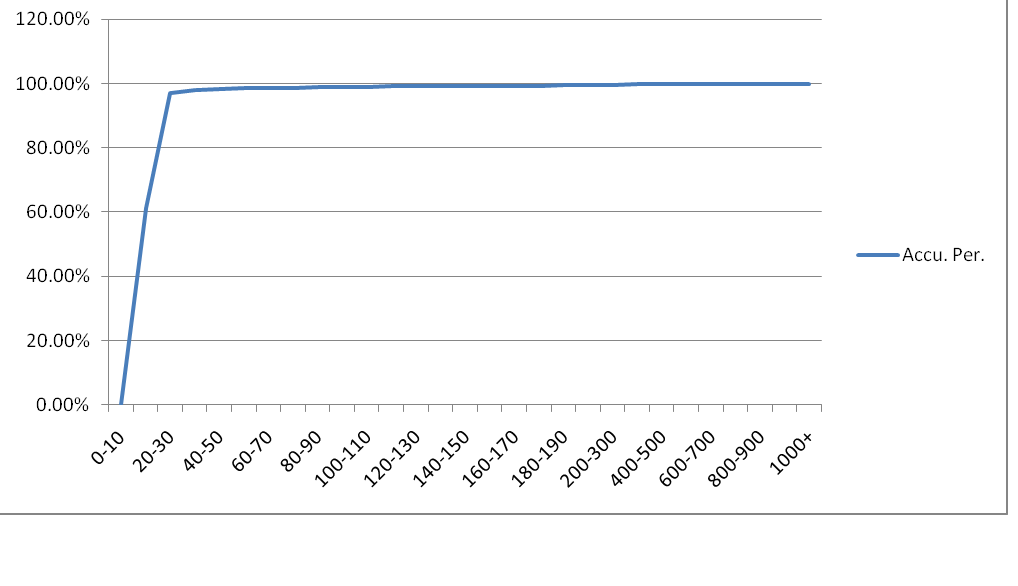
V2 response time
| Resp. Time Range(ms) | Resp Count | Percentage | Accu. Per. |
| 0-10 | 20,258 | 0.28% | 0.28% |
| 10-20 | 4,475,788 | 61.01% | 61.29% |
| 20-30 | 2,623,493 | 35.76% | 97.05% |
| 30-40 | 76,568 | 1.04% | 98.09% |
| 40-50 | 30,340 | 0.41% | 98.51% |
| 50-60 | 12,895 | 0.18% | 98.68% |
| 60-70 | 5,498 | 0.07% | 98.76% |
| 70-80 | 5,129 | 0.07% | 98.83% |
| 80-90 | 8,560 | 0.12% | 98.94% |
| 90-100 | 10,141 | 0.14% | 99.08% |
| 100-110 | 9,741 | 0.13% | 99.21% |
| 110-120 | 7,714 | 0.11% | 99.32% |
| 120-130 | 5,519 | 0.08% | 99.39% |
| 130-140 | 3,668 | 0.05% | 99.44% |
| 140-150 | 2,297 | 0.03% | 99.48% |
| 150-160 | 1,615 | 0.02% | 99.50% |
| 160-170 | 1,176 | 0.02% | 99.51% |
| 170-180 | 918 | 0.01% | 99.53% |
| 180-190 | 666 | 0.01% | 99.53% |
| 190-200 | 489 | 0.01% | 99.54% |
| 200-300 | 14,112 | 0.19% | 99.73% |
| 300-400 | 18,831 | 0.26% | 99.99% |
| 400-500 | 131 | 0.00% | 99.99% |
| 500-600 | 126 | 0.00% | 99.99% |
| 600-700 | 77 | 0.00% | 99.99% |
| 700-800 | 27 | 0.00% | 100.00% |
| 800-900 | 25 | 0.00% | 100.00% |
| 900-1000 | 30 | 0.00% | 100.00% |
| 1000+ | 288 | 0.00% | 100.00% |

High load situation
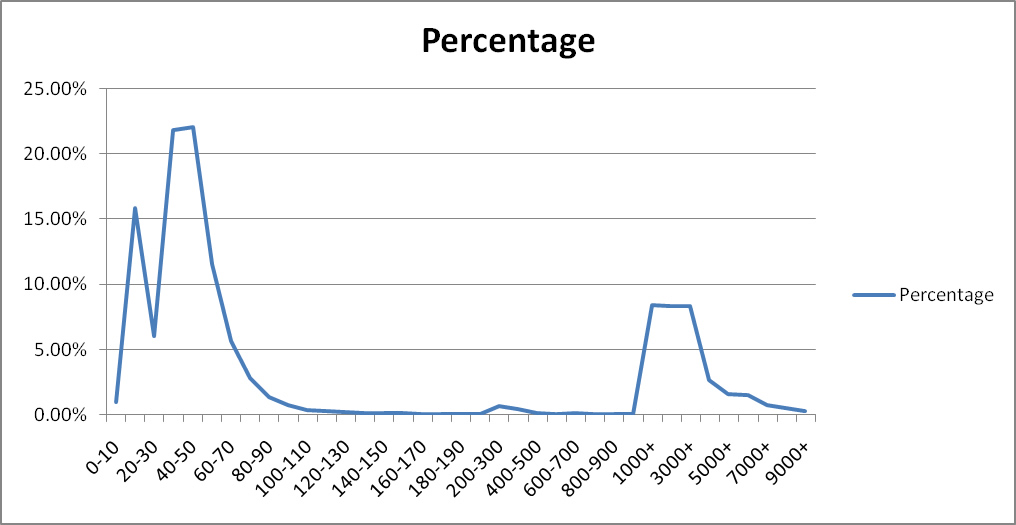
V1 response time
| Resp. Time Range(ms) | Resp Count | Percentage | Accu. Per. |
| 0-10 | 125,181 | 0.99% | 0.99% |
| 10-20 | 2,003,708 | 15.83% | 16.82% |
| 20-30 | 766,219 | 6.05% | 22.87% |
| 30-40 | 2,759,891 | 21.80% | 44.68% |
| 40-50 | 2,793,375 | 22.07% | 66.74% |
| 50-60 | 1,460,567 | 11.54% | 78.28% |
| 60-70 | 711,881 | 5.62% | 83.91% |
| 70-80 | 351,485 | 2.78% | 86.68% |
| 80-90 | 174,165 | 1.38% | 88.06% |
| 90-100 | 88,230 | 0.70% | 88.76% |
| 100-110 | 48,826 | 0.39% | 89.14% |
| 110-120 | 30,767 | 0.24% | 89.39% |
| 120-130 | 20,802 | 0.16% | 89.55% |
| 130-140 | 15,563 | 0.12% | 89.67% |
| 140-150 | 12,479 | 0.10% | 89.77% |
| 150-160 | 10,540 | 0.08% | 89.86% |
| 160-170 | 9,458 | 0.07% | 89.93% |
| 170-180 | 8,818 | 0.07% | 90.00% |
| 180-190 | 8,447 | 0.07% | 90.07% |
| 190-200 | 8,763 | 0.07% | 90.14% |
| 200-300 | 78,584 | 0.62% | 90.76% |
| 300-400 | 49,607 | 0.39% | 91.15% |
| 400-500 | 12,389 | 0.10% | 91.25% |
| 500-600 | 9,764 | 0.08% | 91.32% |
| 600-700 | 10,466 | 0.08% | 91.41% |
| 700-800 | 8,982 | 0.07% | 91.48% |
| 800-900 | 7,357 | 0.06% | 91.54% |
| 900-1000 | 5,113 | 0.04% | 91.58% |
| 1000+ | 1,066,330 | 8.42% | 100.00% |
V2 response time
| Resp. Time Range(ms) | Resp Count | Percentage | Accu. Per. |
| 0-10 | 11,619 | 0.09% | 0.09% |
| 10-20 | 3,423,981 | 27.37% | 27.46% |
| 20-30 | 7,841,554 | 62.68% | 90.14% |
| 30-40 | 862,265 | 6.89% | 97.03% |
| 40-50 | 119,273 | 0.95% | 97.99% |
| 50-60 | 54,839 | 0.44% | 98.43% |
| 60-70 | 23,996 | 0.19% | 98.62% |
| 70-80 | 12,736 | 0.10% | 98.72% |
| 80-90 | 13,441 | 0.11% | 98.83% |
| 90-100 | 17,846 | 0.14% | 98.97% |
| 100-110 | 17,427 | 0.14% | 99.11% |
| 110-120 | 15,161 | 0.12% | 99.23% |
| 120-130 | 11,330 | 0.09% | 99.32% |
| 130-140 | 7,900 | 0.06% | 99.38% |
| 140-150 | 5,229 | 0.04% | 99.43% |
| 150-160 | 3,720 | 0.03% | 99.46% |
| 160-170 | 2,581 | 0.02% | 99.48% |
| 170-180 | 1,994 | 0.02% | 99.49% |
| 180-190 | 1,592 | 0.01% | 99.51% |
| 190-200 | 1,210 | 0.01% | 99.51% |
| 200-300 | 31,230 | 0.25% | 99.76% |
| 300-400 | 25,771 | 0.21% | 99.97% |
| 400-500 | 1,069 | 0.01% | 99.98% |
| 500-600 | 575 | 0.00% | 99.98% |
| 600-700 | 164 | 0.00% | 99.98% |
| 700-800 | 64 | 0.00% | 99.99% |
| 800-900 | 19 | 0.00% | 99.99% |
| 900-1000 | 1 | 0.00% | 99.99% |
| 1000+ | 1,807 | 0.01% | 100.00% |
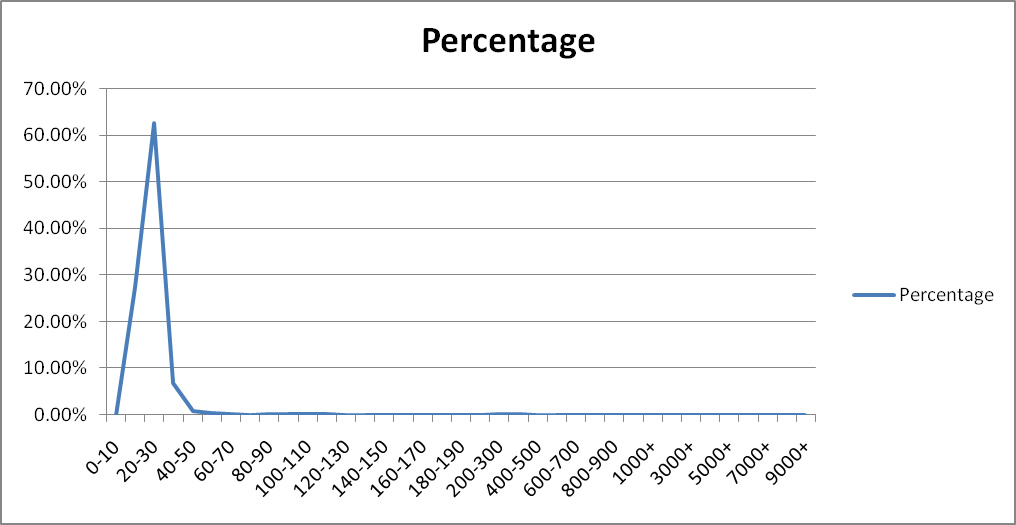

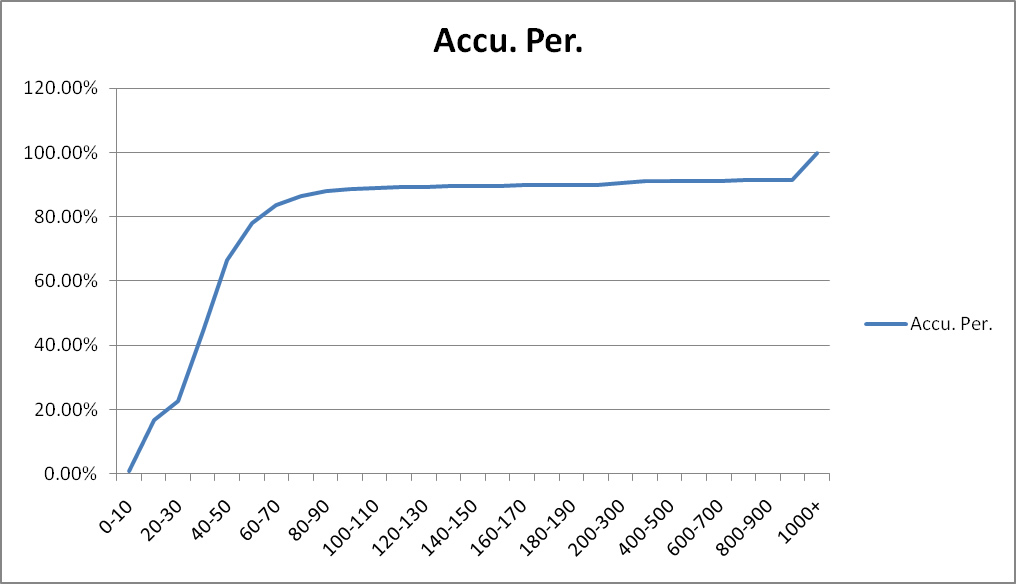
The plots show the V1 was fluctuant at high load situation, and V2 keep consistent at both situation.
This post is just a experience note, not intended to compare procedural and OOP, both paradigm can be used to write excellent code, but I personally prefer OOP and believe it’s easier to write maintainable code.